- Jimmy Jean, Vice-President, Chief Economist and Strategist
Marc-Antoine Dumont, Senior Economist • Florence Jean-Jacobs, Principal Economist
Commodity Trends
Monthly Update: Natural Gas Prices Sink and OPEC+ Extends Production Cuts
March 7, 2024
Highlights
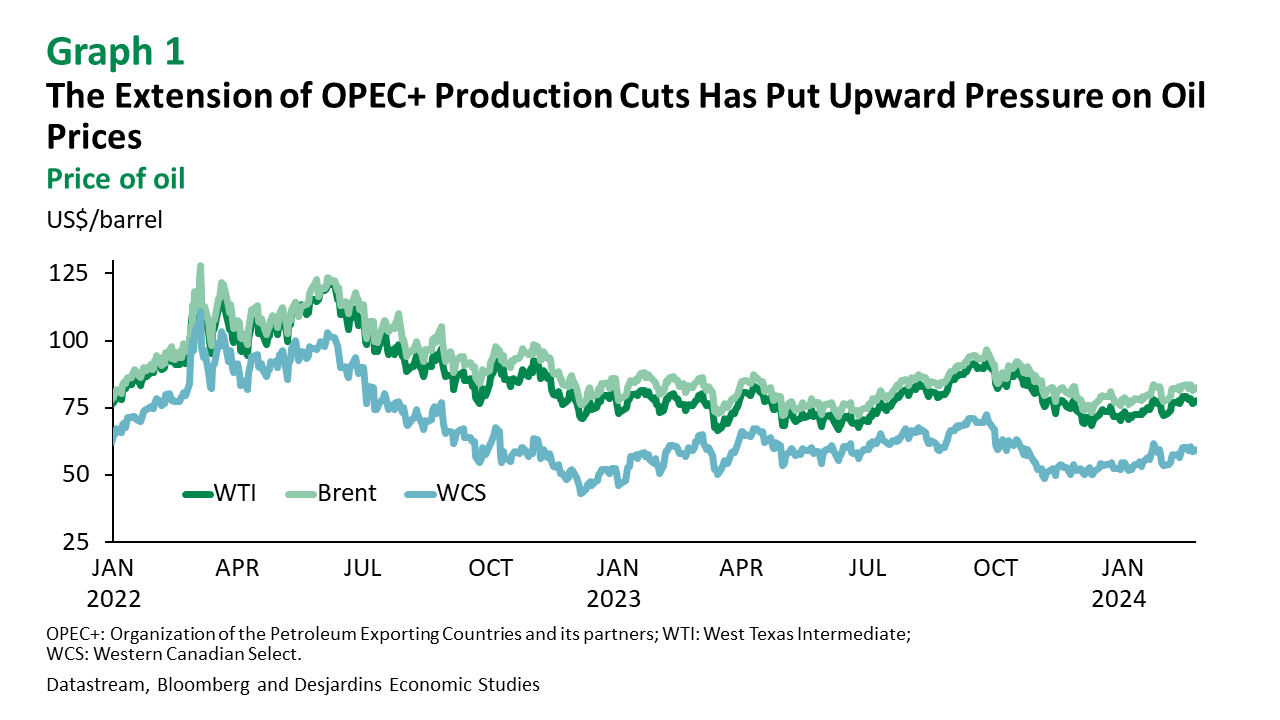
- West Texas Intermediate (WTI) prices climbed in February and are currently situated around US$80 per barrel (graph 1). This uptick coincided with a 0.9 million barrel-per-day increase in output by the Organization of the Petroleum Exporting Countries and its partners (OPEC+), despite voluntary production cuts. The cartel has extended its cuts to the second quarter, contributing to the recent run-up in prices. Another factor driving up prices is the resilience of the world's economies, especially in the United States, which is supporting demand. Under these circumstances, and with economic growth expected to pick up in the second half of the year, we believe the price of WTI will gradually inch up to approximately US$85 per barrel by the end of 2024.
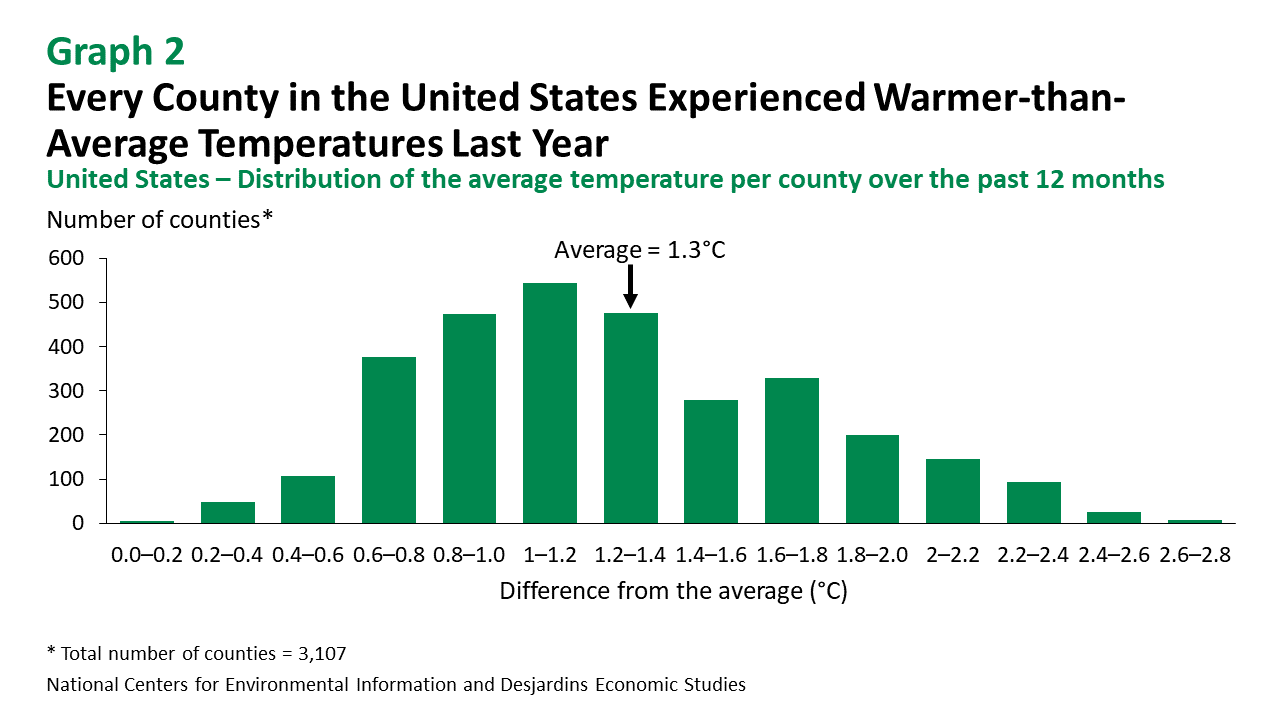
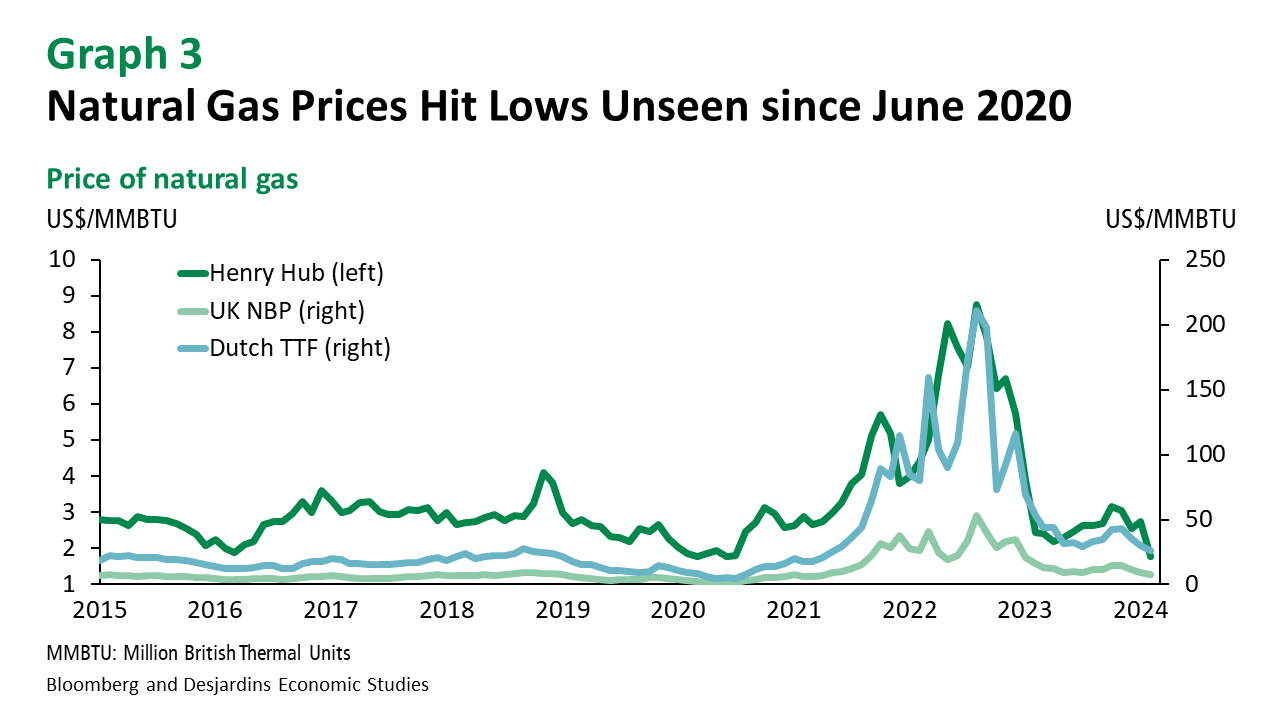
- The market reacted strongly to the Biden administration's announcement that it would pause the approval process for building new liquefied natural gas (LNG) export terminals. Since producers had been counting on a continuous expansion of their export capacity, this about-face has rekindled fears of an oversupplied market. In addition, warm weather in North America has slashed heating demand. Over the past 12 months, the average temperature in the United States has been 1.3°C higher than the historical average (graph 2). In combination with record US output, these factors sent Henry Hub prices down almost 50% from their November 2023 peak (graph 3). Despite plummeting prices, demand for natural gas remains steady, especially in Asia and Europe, and prices are expected to start rising again over the next few months.
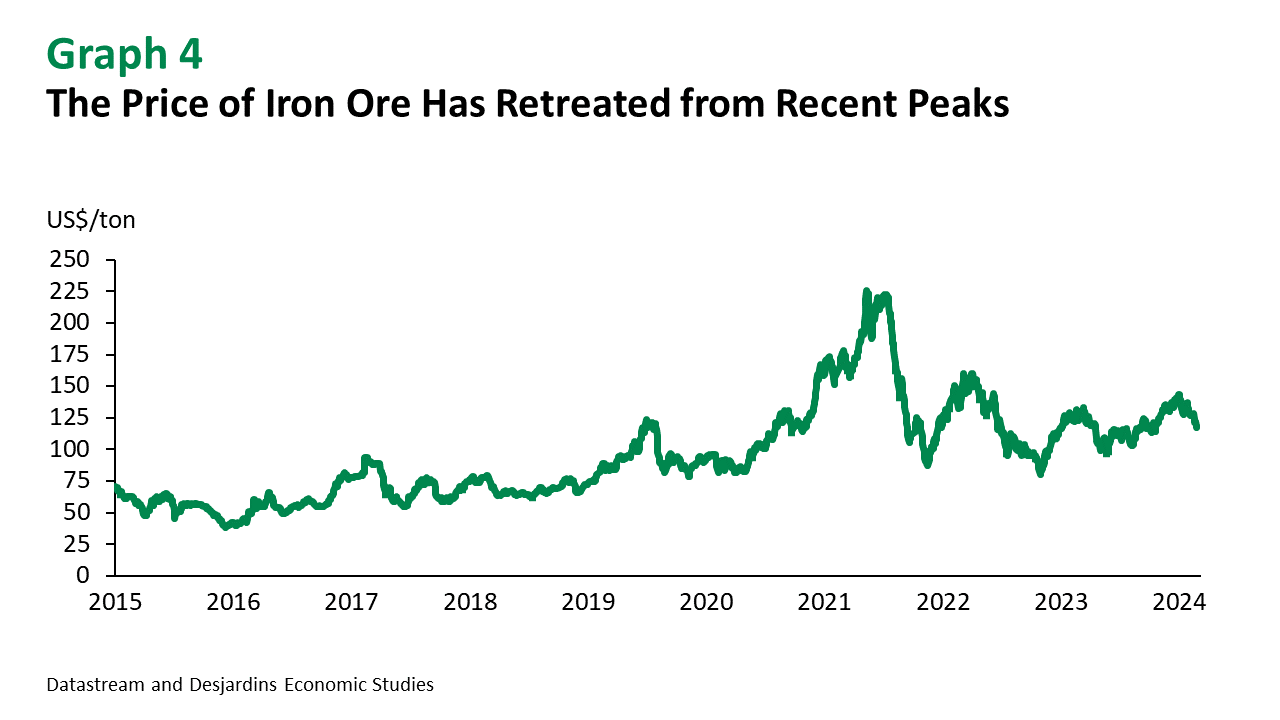
- As expected, the price of iron ore has come back down from its recent highs, which weren't backed by fundamentals (graph 4). China's property sector is still in a slump, which is stifling potential growth in demand for steel and, by extension, iron. But looser monetary policy has raised hopes that the situation could improve in the next few months, especially considering the recent cut to the five-year loan prime rate, which is used as the reference rate for Chinese mortgages. As for the rest of the base metals, economic growth is expected to accelerate in the second half of 2024, pushing prices even higher. The price of gold has continued to surprise to the upside, hitting a record-breaking US$2,127 per ounce. But the price of this safe-haven metal is expected to falter in the next few quarters.
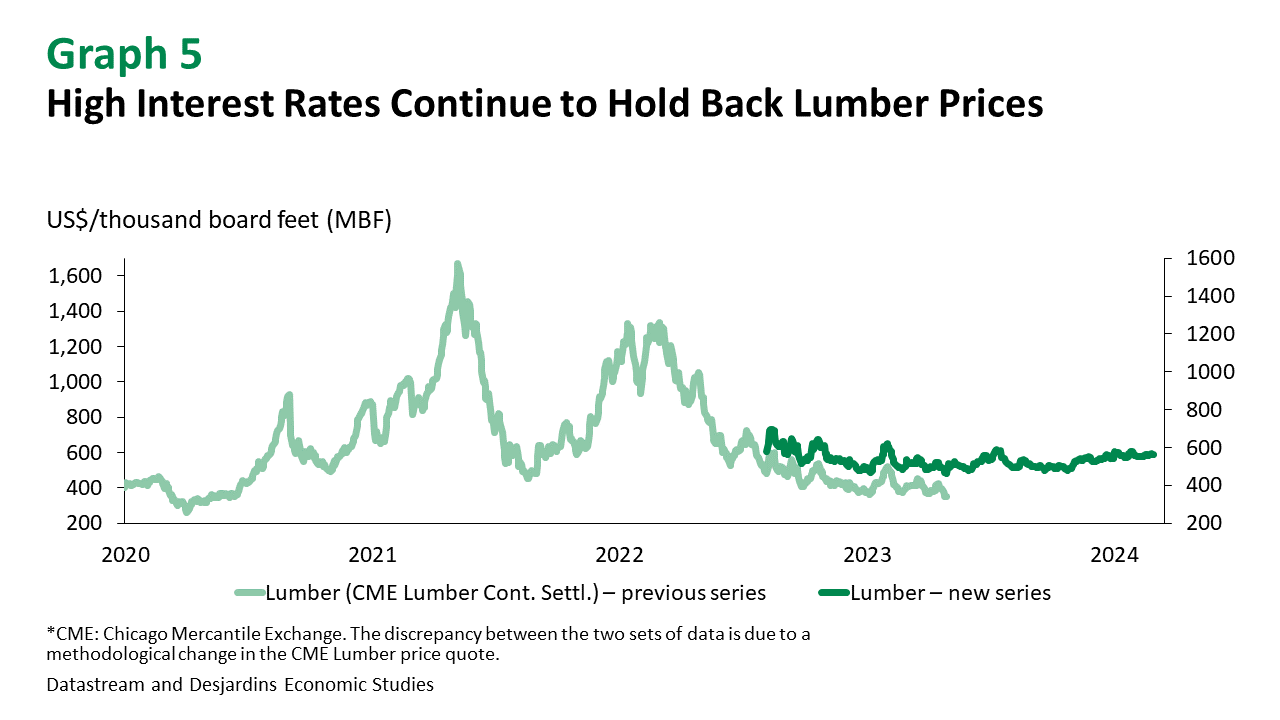
- Lumber prices are still low but should recover as the weather warms up and monetary easing boosts residential construction and renovation (graph 5). But prices will likely stay below their 2021 and 2022 peaks. Meanwhile, the US has announced that it will raise duties on Canadian softwood lumber, which has dimmed the prospects of producers on this side of the border. The tariff will increase from 8.05% to 13.86% in August 2024, compounding the financial hardships these producers already face. Low prices over the past 18 months have already cut into their profitability.
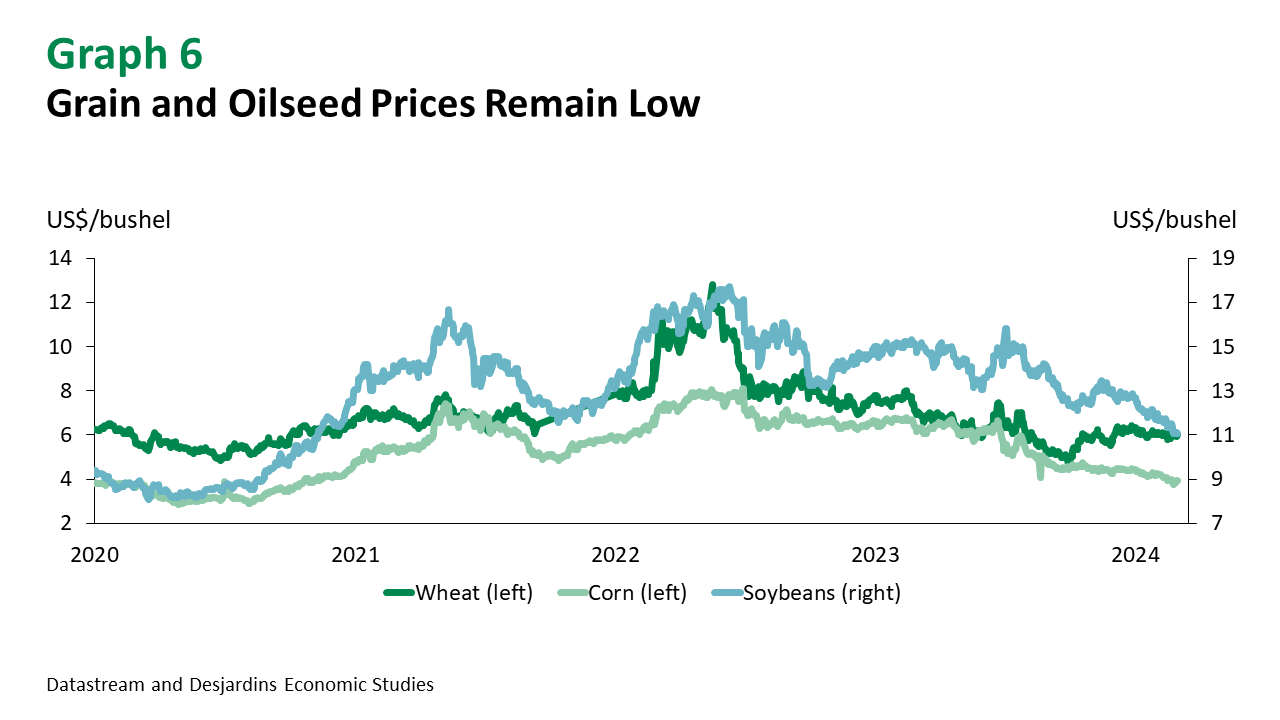
- Downside risks held back grain and oilseed prices at the start of the year (graph 6) and the trend is expected to last through the next few months. Although the Red Sea crisis has driven up the cost of some agricultural commodities like coffee and cocoa, the prices of corn, soybean and wheat haven't been affected. The latest USDA report predicts prices for these three commodities will slide in 2024 and 2025. Heavy rainfall finally washed away fears of drought in Brazil, leading forecasters to revise projected soybean and corn crop yields upward. As for wheat, abundant supply from the United States and Russia has kept a lid on prices. Meanwhile, Chinese demand seems sluggish, which is keeping soybean, corn and wheat prices low.
Scenario Adjustments
- Energy: Natural gas prices revised downward.
- Base metals: No change.
- Precious metals: No change.