How to read an options table
Options ratings are generally displayed as follows in the financial pages of specialized publications and online.
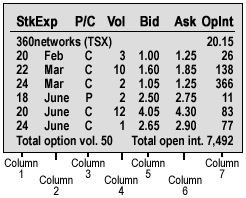
Columns 1: Strike price - This is the stated price per share for which an underlying stock may be purchased (for a call) or sold (for a put) upon the exercise of the option contract. Option strike prices typically move by increments of $2.50 or $5.00.
Column 2: Expiry date - This shows the termination date of an option contract. Remember that options listed in North America expire on the third Friday of the expiry month.
Column 3: Call or put - This column refers to whether the option is a call (C) or put (P).
Column 4: Volume - This indicates the total number of options contracts traded for the day. The total volume of all contracts is listed at the bottom of each table.
Column 5: Bid - This indicates the highest price someone is willing to pay for the contract.
Column 6: Ask - This indicates the lowest price at which someone is willing to sell a contract.
Column 7: Open interest - Open interest is the number of options contracts that are open. This information is of interest to investors who trade large blocks of options (500 contracts, for example).
Useful link
TMX - Montréal Exchange: see the Options FAQ.
Tools and tips
Why use options?
Options are versatile securities that allow you to profit when a stock price falls (put options) or when it goes up (call options).